Visualize Your Data Like a Pro with ChartStud: The Ultimate Chart & Dashboard Tool
Published on: November 24, 2025
Data is everywhere. In every business meeting, marketing campaign, and product launch, numbers are flying around. Yet, despite the flood of information, many teams struggle to make sense of it all. Numbers alone don’t tell the full story. Context, visualization, and collaboration transform raw data into insights that drive decisions.
This was the challenge I faced when building ChartStud — my journey as a founder, building a tool to help teams visualize, collaborate, and extract insights from their data.
The Problem: Too Much Data, Too Little Clarity
I remember the early days of my SaaS product. We were collecting metrics from user actions, AI features, and marketing campaigns. But looking at spreadsheets and raw numbers wasn’t enough.
Questions piled up:
- Which users were truly engaging with our product?
- How were AI features actually helping?
- Which actions were driving retention and growth?
Every answer required digging through multiple dashboards, creating custom reports, and sometimes guessing at insights. It was slow, fragmented, and often overwhelming.
The Spark: Building ChartStud
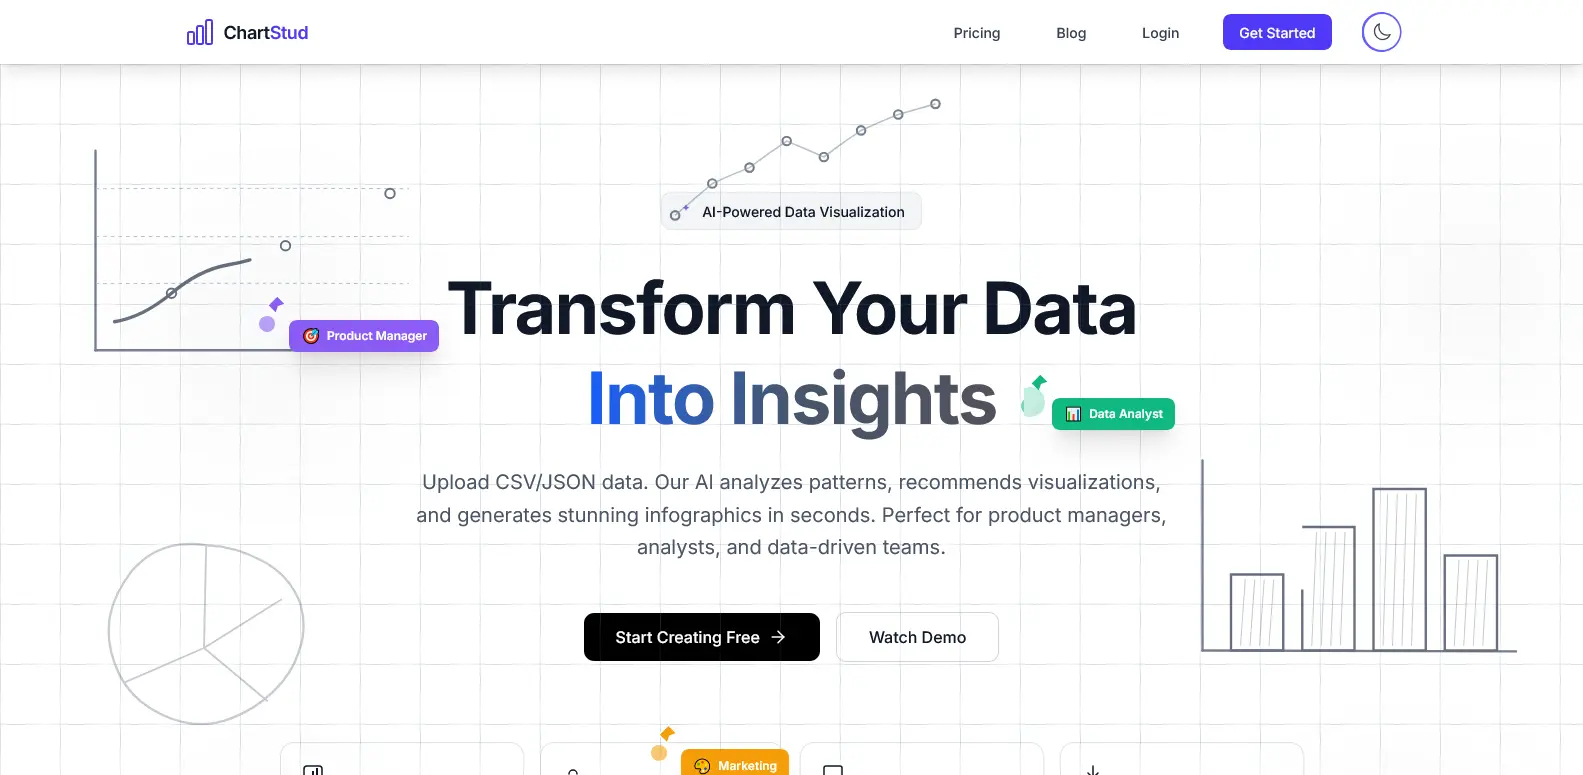
I wanted a solution — not just for my team, but for any SaaS, marketing, or analytics-driven business. That’s how ChartStud was born.
The goal was simple: make data visualization simple, interactive, and collaborative. But I also wanted it to be smart. Teams should not only see their data but understand it instantly, with AI-powered insights answering questions naturally.
The Three Pillars
- Ease of Use: Anyone, even without a design background, should be able to build charts.
- Real-Time Collaboration: Teams needed to work together on charts simultaneously, like Google Docs for numbers.
- Actionable AI Insights: Asking “what’s happening in my data?” should get clear, meaningful answers.
Key Features of ChartStud
1. Interactive Charts and Multi-Chart Dashboards
Create bar charts, line charts, choropleth maps, and multi-chart dashboards in seconds. See trends across multiple datasets on a single screen, from sales by region to campaign performance.
2. AI-Powered Insights
Ask questions about your data like “Which region has the highest engagement?” or “Which marketing channel is driving conversions?” and get instant answers in plain English. No SQL or formulas required.
3. Real-Time Team Collaboration
Multiple users can edit, comment, and highlight data on dashboards in real-time. Collaboration becomes faster, dynamic, and accurate.
4. Admin Analytics for Founders
Track how people use your app, AI feature engagement, device preferences, and retention metrics. Gain a **360° view** of your product performance.
The Story Behind the Data
We first tested ChartStud with Manchester City football stats. Within minutes, we had an interactive dashboard showing top scorers, assists, and performance trends — instantly visualized and shareable. This experience inspired the storytelling-first approach we now apply to SaaS metrics, marketing, and user engagement.
Why ChartStud Matters for SaaS Teams
Raw data is just numbers. ChartStud turns it into actionable insights:
- Track activation and retention metrics
- Monitor AI feature usage
- Visualize marketing performance
- Collaborate in real-time
- Make data-driven decisions fast
Get Started with ChartStud
Whether you’re a founder, marketer, or product manager, ChartStud helps you turn raw data into actionable insights. Create interactive dashboards, get AI insights, and collaborate in real-time.
Start today and transform how your team sees and acts on data:
- Try ChartStud now
- Learn more about tracking ROI: ROI